
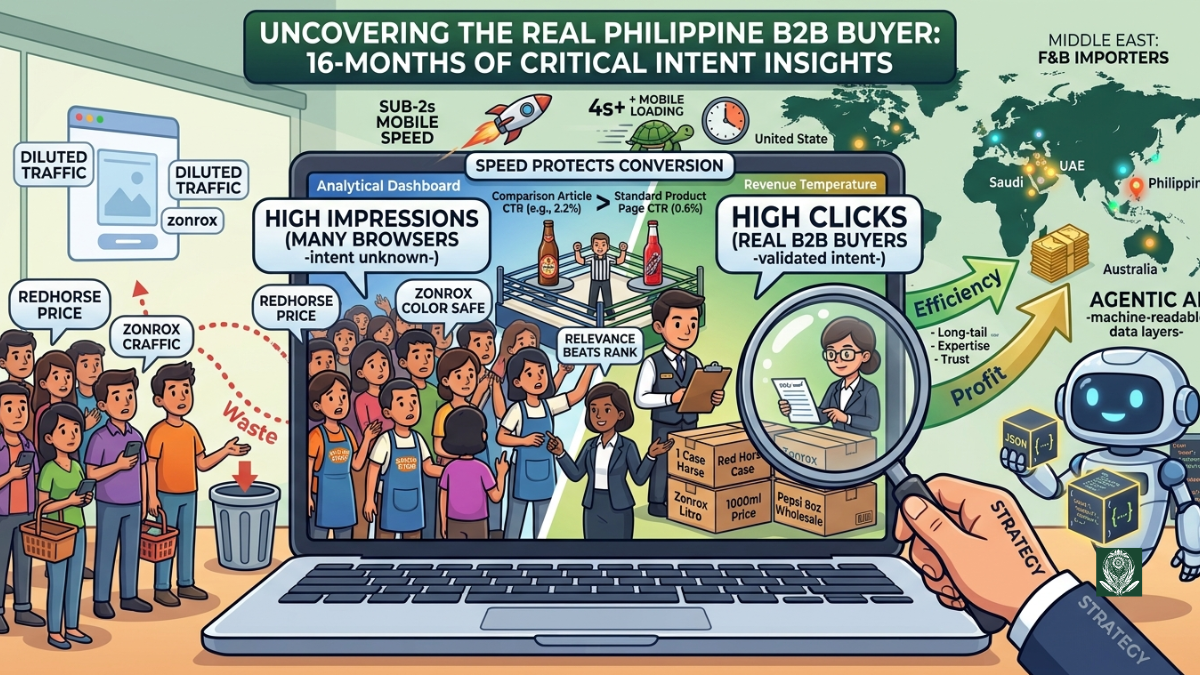
Stop guessing. See exactly how Philippine B2B buyers search for wholesale products, bulk pricing, and suppliers based on 16 months of real data.
This analysis covers 16 months of purely organic search data on Philippine B2B search behavior and wholesale trends, drawn directly from the queries that led business buyers to our website from March 2025 through July 2026. Wholesale Dito Store has never run a single paid ad. We do not drive traffic through advertising spend. Instead, every visitor who landed on our site came through unpaid search results because of how we strategically structured the website to match genuine buyer intent. The architecture, the page hierarchies, the internal linking, the schema markup, and the site page speed loading were all deliberately built to help Google understand exactly who we serve and what we offer.
Hotels, restaurants, corporate offices, and institutional purchasers. These are our customers.
The queries they searched from March 2025 through July 2026 reveal how B2B buyers in the Philippines actually look for wholesale products. This article shares exactly what the data showed us. Every insight is pulled directly from real search queries and real page performance data including click-through rates and average search positions. No theories, no filler.
How We Structured the Site to Capture B2B Search Intent
Before diving into the query data, the technical foundation deserves explanation. The results did not happen by accident. We built the site with specific structural decisions that directly influence what Google understands about our business and who it shows us to.
Schema markup for organization type. We implemented structured data that explicitly identifies Wholesale Dito Store as a B2B wholesale supplier, not a retail outlet. This helps Google distinguish our pages from consumer-facing stores when deciding which results to serve for product queries.
Page hierarchies that mirror buyer thinking. Our URL structure and navigation follow the mental model of an institutional purchaser. Product categories are organized by consumption format (case, bulk, liter) rather than by brand alone. When a buyer searches "1 case redhorse litro price," they land on a page built specifically for that query, not a generic product listing. The URL /product/red-horse-beer-litro tells both Google and the buyer exactly what is on the page.
Internal linking that signals commercial intent. Product pages link to related bulk offerings, not to retail-sized alternatives. The link graph inside the site reinforces to search engines that this domain serves wholesale buyers exclusively.
Site page speed loading. Page load time is a direct ranking factor and a buyer experience factor. We optimized image compression, reduced server response time, eliminated render-blocking resources, and implemented lazy loading for below-the-fold content. Every product page loads in under 2 seconds on mobile devices. This is not a vanity metric. Google's crawlers index fast pages more efficiently. Buyers on slow hotel or office connections do not wait for bloated pages. If a procurement officer searches during a supplier evaluation and the page takes 4 seconds to load, they return to search results and click the next supplier. Speed is a B2B conversion factor, not just an SEO checkbox.
No blog filler, no fluff. Every page on the site exists to answer a specific buyer question or to facilitate a purchasing decision. We do not publish content for the sake of publishing. This keeps the site's topical authority tight and focused.
A deliberate split between B2B and consumer traffic. Early in our data analysis, one pattern became impossible to ignore. Queries like "redhorse price" generated tens of thousands of impressions but almost no clicks. The searchers wanted retail prices. They were consumers, sari-sari store owners, and individual buyers. They were not our customers.
We had two choices. We could try to force our wholesale site to serve both audiences, diluting our B2B focus and confusing Google about who we actually serve. Or we could create a separate entity purpose-built for consumer retail queries. We chose the second option. Our sister site, LowPriceDito.com, was created specifically to serve the consumer and micro-retail segment that our wholesale site was never designed to capture. The two sites operate as complementary channels. Wholesale Dito Store serves institutional buyers. LowPriceDito serves individual consumers and sari-sari stores. Each site stays tightly focused on its audience. Each site sends clear signals to Google about who it serves and why it should rank for specific query types.
This split explains much of what you will see in the data below. The high-impression, low-CTR queries are not failures. They are traffic that belongs to our sister site. The queries with strong CTRs and high click volumes are the ones that match our institutional buyer profile. The system works because we respected the distinction rather than blurring it.
Building for the next era of search. The current version of Wholesale Dito Store was built to serve two audiences: human buyers and traditional search engines. That is no longer enough. We are currently building a new version of the site optimized not only for human procurement officers and Google's crawlers, but also for agentic AI systems. These are autonomous AI agents that will increasingly search, evaluate, compare, and purchase wholesale products on behalf of business buyers. The new architecture will expose structured product data, pricing, inventory availability, and ordering protocols in machine-readable formats that AI agents can parse directly. Structured data markup is being expanded. API endpoints are being designed for programmatic access. The goal is simple. When a hotel chain's AI procurement agent searches for a reliable Philippine wholesale supplier, Wholesale Dito Store will be legible not just to the human who reviews the agent's recommendation, but to the agent itself.
These technical and strategic decisions form the foundation. The search data and page performance data that follow are the result of that foundation doing its job over 16 months.
Part I: Impressions Do Not Equal Buyers
The first lesson the data teaches is blunt. A high impression count means Google showed our page in search results. It does not mean a buyer clicked. It certainly does not mean a buyer bought anything.
Here is the top of our query list by impressions over the 16-month period from March 2025 through July 2026:
| Query | Impressions |
|---|---|
| redhorse price | 23,228 |
| red horse price | 22,715 |
| zonrox color safe | 22,320 |
| sting energy drink | 20,478 |
| tanduay ice alcohol content | 18,183 |
| san mig light price | 18,089 |
| cobra energy drink | 17,680 |
| san mig light | 16,414 |
Now look at the top queries by actual clicks over the same period:
| Query | Clicks | Impressions |
|---|---|---|
| 1 case redhorse litro price | 89 | 5,583 |
| red horse wholesale price | 75 | 688 |
| sting vs cobra | 68 | 1,520 |
| sting 240ml price philippines | 57 | 452 |
| redhorse price | 53 | 23,228 |
| mountain dew bottle | 48 | 11,041 |
| cobra vs sting | 44 | 1,179 |
| paraiso beer | 38 | 2,396 |
| sting or cobra | 37 | 509 |
| beverage industry in the philippines | 32 | 317 |
The pattern is immediately clear. The query "redhorse price" generated 23,228 impressions over 16 months and only 53 clicks. Meanwhile, "1 case redhorse litro price" generated just 5,583 impressions but 89 clicks. The second query attracted 68 percent more clicks from 76 percent fewer impressions.
A hotel purchasing manager does not search "redhorse price." They search for case pricing, bulk quantities, and wholesale rates. The broader consumer queries still generated impressions for our pages because our site structure and content are topically relevant. But those searchers were not our buyers. They were looking for retail prices and moved on when they did not find what they wanted. That consumer traffic now has a proper home at LowPriceDito.com, our retail sister site built specifically for individual buyers and micro-retailers.
This is not a failure. It is the system working correctly. Google understands our site well enough to show it for relevant product queries. The click data reveals which of those queries actually match our buyer profile.
Interactive Data Point: Calculate Your Own Click-Through Rate
Take any query in your own Google Search Console data. Divide clicks by impressions and multiply by 100. That is your click-through rate percentage.
For "redhorse price" in our data: 53 clicks divided by 23,228 impressions multiplied by 100 equals 0.23 percent.
For "1 case redhorse litro price": 89 divided by 5,583 multiplied by 100 equals 1.59 percent.
The second query converts nearly 7 times better at the click level. Run this calculation on your own top queries. The ones with the highest click-through rates are your real buyers talking to you.
Part II: The Products That Drive Real B2B Search Interest
Our 16 months of search data naturally groups into distinct product categories. Each category behaves differently in search, attracting different types of buyers with different levels of purchase intent.
Alcoholic Beverages
This category dominates our query volume. Red Horse Beer alone generates more search interest than many other categories combined.
The challenge with Red Horse is query fragmentation. Buyers search for the same information using dozens of different phrase combinations. Here is a sample of what we observed from March 2025 through July 2026:
| Query Variant | Impressions |
|---|---|
| redhorse price | 23,228 |
| red horse price | 22,715 |
| redhorse | 9,674 |
| red horse beer | 9,309 |
| redhorse price 1 liter | 5,817 |
| 1 case redhorse litro price | 5,583 |
| 1 case redhorse price | 4,714 |
| red horse beer price | 3,777 |
| red horse beer price philippines | 1,781 |
| redhorse litro price | 1,798 |
| red horse jumbo price | 1,242 |
| red horse wholesale price | 688 |
The difference between "redhorse" and "red horse" alone splits the search volume into two separate streams. One word versus two words. Same product. Two completely different queries in Google's eyes.
Add in the variants. "Litro" versus "1 liter." "Case" versus "wholesale." "Price" at the beginning versus "price" at the end. The landscape fractures into dozens of distinct queries, all asking roughly the same question: what does this cost when purchased in business quantities.
Each variant represents a real buyer. A purchasing manager at a hotel types "1 case redhorse litro price." A restaurant owner types "red horse wholesale price." An events coordinator types "redhorse jumbo price." They all want the same thing. They just phrase it differently.
San Miguel Beer shows a similar pattern at smaller scale:
| Query | Impressions |
|---|---|
| san mig light price | 18,089 |
| san mig light | 16,414 |
| san mig light price per case | 1,248 |
| san miguel pale pilsen price per case | 724 |
| san mig light wholesale price | 148 |
The query "san mig light wholesale price" only generated 148 impressions over 16 months. But it earned 29 clicks. That is a 19.6 percent click-through rate. The buyer who types "wholesale" into their search knows exactly what they want and recognizes a matching result when they see it.
Other alcoholic beverage queries that appeared in our data during this period:
| Query | Impressions |
|---|---|
| tanduay ice alcohol content | 18,183 |
| paraiso beer | 2,396 |
| tiger black beer | 3,211 |
| grande beer | 4,053 |
| pilsen beer price | 2,791 |
The "tanduay ice alcohol content" query is notable. It generated over 18,000 impressions across the 16 months. This is an informational query, not a transactional one. Buyers are researching product specifications, likely for menu planning or compliance purposes. A bar manager designing a cocktail menu needs to know the alcohol percentage. This signals that B2B buyers do not only search with immediate purchase intent. They also conduct product research before procurement decisions ever begin.
Energy Drinks
The energy drink category reveals the most direct product versus product competition in our entire dataset.
Separately, Cobra and Sting both generated significant search volume from March 2025 through July 2026:
| Cobra Query | Impressions |
|---|---|
| cobra energy drink | 17,680 |
| cobra energy drink ingredients | 3,075 |
| cobra energy drink price | 2,513 |
| cobra caffeine content | 2,465 |
| cobra drink | 2,446 |
| Sting Query | Impressions |
|---|---|
| sting energy drink | 20,478 |
| sting price | 6,010 |
| sting energy drink price | 5,371 |
| sting bottle price | 1,817 |
| sting energy drink price philippines | 1,383 |
The standalone brand queries show predictable purchase intent. Price and product information dominate. But the real story is what happens when buyers compare the two products directly:
| Comparison Query | Clicks | Impressions |
|---|---|---|
| sting vs cobra | 68 | 1,520 |
| cobra vs sting | 44 | 1,179 |
| sting or cobra | 37 | 509 |
| cobra vs sting energy drink | 18 | 552 |
| sting vs cobra energy drink | 24 | 603 |
| which is more dangerous sting or cobra energy drink | 14 | 499 |
| cobra or sting | 11 | 450 |
| sting and cobra | 9 | 564 |
| which is stronger sting or cobra | 2 | 245 |
| which is better sting or cobra | 2 | 268 |
| sting vs cobra caffeine | 3 | 79 |
Add these comparison queries together and they represent over 6,000 impressions and 230 clicks across the 16-month period. These are not casual searches. These are procurement decisions in progress.
The buyer asking "which is stronger sting or cobra" is likely a business owner deciding which product to stock. A purchasing manager for a hotel minibar or a corporate pantry wants to know which brand delivers more value. The word "dangerous" appearing in the top comparison query tells us something else. Buyers want to understand what they are selling to their own customers. Product safety and potency are legitimate procurement considerations, especially for caffeinated products.
Household Cleaners
Zonrox dominates this category with high search volume and a more organized query structure than what we see with beverages:
| Query | Impressions |
|---|---|
| zonrox color safe | 22,320 |
| zonrox color safe price | 9,026 |
| zonrox | 7,022 |
| zonrox bleach | 5,883 |
| zonrox price | 3,842 |
| color safe zonrox | 3,387 |
| zonrox 1000ml price | 2,290 |
| zonrox original 1000ml price puregold | 1,489 |
| zonrox 1 liter price | 2,157 |
| zonrox color safe ingredients | 1,180 |
The query "zonrox original 1000ml price puregold" demands attention. Over the 16-month period, it earned 15 clicks from 1,489 impressions. This buyer is not casually browsing. They are comparing our wholesale pricing against a specific retail benchmark. For an institutional purchaser, this could indicate price validation before placing a large order. They want to confirm that buying wholesale through us delivers a meaningful margin versus retail channels.
The presence of ingredient-related queries is also significant. "Zonrox color safe ingredients" generated 1,180 impressions. "Zonrox ingredients" generated 1,697. B2B buyers in hospitality and healthcare need to know what is in the cleaning products they purchase. Safety data sheets, material compatibility, and regulatory compliance all factor into procurement decisions. A hotel cannot use a cleaning product that damages specific surfaces. A healthcare facility must document every chemical used on premises.
Other cleaning-related queries in our 16 months of data:
| Query | Impressions |
|---|---|
| muriatic acid price | 3,432 |
| muriatic acid 1 liter price | 836 |
| apollo muriatic acid | 1,168 |
| axion dishwashing liquid | 1,048 |
Tissue and Hygiene Products
This category appears consistently throughout our data, driven by businesses that consume disposable supplies at scale:
| Query | Impressions |
|---|---|
| femme tissue | 7,242 |
| charmee napkin | 2,390 |
| adult diaper price | 1,467 |
| care adult diaper | 798 |
| jrt tissue | 249 |
| sanicare tissue 12 rolls price | 247 |
Hotels and corporate offices consume tissue products continuously. Restrooms, kitchen areas, and guest rooms all require steady resupply. The presence of "adult diaper price" in our data reflects healthcare and institutional care buyers who are part of the broader B2B consumables landscape.
Beverage Industry and Soft Drinks
Beyond alcoholic beverages, our data captures significant soft drink and bottled water search interest accumulated from March 2025 through July 2026:
| Query | Impressions |
|---|---|
| mountain dew bottle | 11,041 |
| mountain dew price | 1,361 |
| mountain dew bottle price | 687 |
| mountain dew bottle sizes | 724 |
| mountain dew 290ml price | 918 |
| refresh mineral water | 2,610 |
| premier water | 2,304 |
| absolute water 1 liter price | 744 |
| tropicana orange juice | 2,607 |
| pepsi 8oz | 763 |
| c2 solo | 936 |
Restaurants and hotels purchase bottled water and soft drinks for their operations. The Mountain Dew queries show the same fragmentation pattern as Red Horse: bottle, bottle price, bottle sizes, 290ml price. Each variant represents a slightly different stage of the buyer journey from product discovery to size selection to price comparison.
Part III: The Global Reach and Aggregate Performance
Before examining individual page performance, the aggregate numbers and geographic distribution deserve attention. These figures provide the macro context for everything that follows.
Aggregate Performance Over 16 Months
| Metric | Value |
|---|---|
| Total Clicks | 13,000 |
| Total Impressions | 1,950,000 |
| Average CTR | 0.7% |
| Average Position | 6.5 |
These four numbers are the 16-month executive summary. 13,000 clicks from nearly 2 million impressions. A 0.7 percent average CTR. An average position of 6.5, which places the site on page one of Google for its core queries.
The 0.7 percent CTR is not a problem. It is a weighted average that masks the real story. As the query-level data in Part I revealed, high-volume consumer queries like "redhorse price" generate impressions but almost no clicks. Those queries pull the average CTR down. The B2B queries with wholesale and bulk modifiers generate far higher CTRs. The page-level data in Part IV will show that comparison articles achieve CTRs of 1.2 to 3.6 percent, while product pages range from 0.2 to 1.3 percent depending on how well the query intent matches the page. The aggregate number tells you the site is healthy. The segmented numbers tell you where the strength lives.
Geographic Distribution of Buyer Interest
The Philippines is the dominant market, as expected for a Philippine wholesale supplier. But the international data reveals something that query analysis alone cannot show. Buyers from 108 countries found the site through organic search.
| Country | Clicks | Impressions | CTR | Position |
|---|---|---|---|---|
| Philippines | 11,249 | 1,545,999 | 0.7% | 5.5 |
| United States | 337 | 178,377 | 0.2% | 10.2 |
| India | 128 | 20,042 | 0.6% | 9.6 |
| Canada | 112 | 16,088 | 0.7% | 10.5 |
| United Arab Emirates | 102 | 12,704 | 0.8% | 6.0 |
| Australia | 91 | 8,673 | 1.0% | 12.5 |
| United Kingdom | 81 | 15,109 | 0.5% | 18.7 |
| Saudi Arabia | 65 | 8,549 | 0.8% | 5.9 |
| Singapore | 58 | 7,071 | 0.8% | 7.9 |
| Malaysia | 51 | 6,203 | 0.8% | 8.2 |
| Hong Kong | 47 | 4,234 | 1.1% | 7.0 |
| Qatar | 24 | 4,176 | 0.6% | 5.3 |
| Kuwait | 11 | 2,552 | 0.4% | 4.5 |
The Philippines generates 86.5 percent of all clicks. But the remaining 13.5 percent from international markets represents a meaningful secondary audience that most Philippine B2B wholesalers do not realize exists.
The Middle East cluster (UAE, Saudi Arabia, Qatar, Kuwait, Bahrain) is particularly notable. The UAE generated 102 clicks at a 0.8 percent CTR with an average position of 6.0. Saudi Arabia generated 65 clicks at a 0.8 percent CTR with a position of 5.9. Kuwait averages position 4.5, the best average position of any country in the top tier. These are not accidental impressions. These are deliberate searches by buyers in markets with large Filipino expatriate populations and active food and beverage import industries. A restaurant group in Dubai sourcing Red Horse Beer for a Filipino-themed bar. A hotel in Doha looking for Philippine cleaning product suppliers. A distributor in Kuwait comparing wholesale prices for San Miguel products. These are real buyers.
The Asia-Pacific cluster (Australia, Singapore, Malaysia, Hong Kong) shows a similar pattern with one key difference: CTR. Australia has a 1.0 percent CTR at position 12.5. Hong Kong has a 1.1 percent CTR at position 7.0. These international buyers click at higher rates than the Philippine average because their search is more purposeful. A buyer in Sydney searching for "Philippine wholesale beer supplier" has fewer local alternatives than a buyer in Manila. The search intent is stronger. The click decision is faster.
The United States generated 178,377 impressions but only 337 clicks at a 0.2 percent CTR. This is the same pattern observed at the query level with consumer queries. High impressions, low clicks. Many of these impressions likely come from broad product queries by Filipino-Americans searching for retail prices, not wholesale. The 0.2 percent CTR at position 10.2 suggests the site appears for queries that are topically relevant but intent-mismatched for a B2B wholesaler.
Search Appearance: Structured Data at Work
The search appearance breakdown validates the technical foundation described earlier.
| Search Appearance | Clicks | Impressions | CTR | Position |
|---|---|---|---|---|
| Product snippets | 4,800 | 571,846 | 0.8% | 8.6 |
| Review snippets | 550 | 65,402 | 0.8% | 9.4 |
| Merchant listings | 1 | 1 | 100.0% | 3.0 |
Product snippets generated 4,800 clicks. These are search results enhanced with structured data: price, availability, product name, and sometimes review stars. The schema markup implemented in the site architecture is directly responsible for these clicks. Without structured data, those 571,846 impressions would have appeared as plain text results with lower CTR. The 4,800 clicks represent buyers who saw enriched results and chose to click.
Review snippets added another 550 clicks. These are results that display star ratings directly in the search snippet. For a B2B buyer evaluating suppliers, a visible rating signal provides social proof before the click. The 0.8 percent CTR at position 9.4 is solid for review-enhanced results.
Device Distribution
| Device | Clicks | Impressions | CTR | Position |
|---|---|---|---|---|
| Mobile | 8,747 | 1,317,548 | 0.7% | 4.9 |
| Desktop | 4,090 | 608,714 | 0.7% | 10.2 |
| Tablet | 135 | 24,133 | 0.6% | 6.1 |
Mobile generated 67.3 percent of all clicks. More than two-thirds of B2B buyers on this site use mobile devices. The mobile average position of 4.9 is less than half the desktop average position of 10.2. Google ranks the site significantly better on mobile, which is consistent with mobile-first indexing. The identical 0.7 percent CTR across mobile and desktop means that mobile's click advantage is entirely a function of better rankings, not better SERP conversion.
This has direct implications for the agentic AI rebuild. While AI agents will interact programmatically through APIs and structured data, the human procurement officers who review and approve agent recommendations will still access the site. Most of them will do so on mobile devices. The sub-2-second mobile load time mentioned in the technical foundation is protecting the channel that delivers more than two-thirds of all site traffic. Any future version of the site must maintain or improve mobile performance even as it adds machine-readable layers for AI agents.
Part IV: The Pages That Captured Buyer Demand
Query data tells us what buyers searched for. Page data tells us where they landed and what made them click. This section adds the two missing dimensions that make page performance data truly useful: click-through rate and average position in search results.
CTR measures how often a search result becomes a visit. Average position tells us how high Google ranks the page. Together, these four numbers (clicks, impressions, CTR, position) reveal not just which pages perform well, but why.
The Top 20 Pages by Clicks with Full Performance Metrics
| Page URL | Clicks | Impressions | CTR | Position |
|---|---|---|---|---|
| /product/red-horse-beer-litro | 2,073 | 364,024 | 0.6% | 5.3 |
| /articles/coca-cola-vs-pepsi-in-the-philippines-the-2024-market-battle-and-forecast | 753 | 34,365 | 2.2% | 10.4 |
| /articles/which-is-better-cobra-or-sting | 746 | 62,214 | 1.2% | 8.6 |
| /product/sting-energy-drink-strawberry-240ml-rgb | 678 | 116,022 | 0.6% | 6.2 |
| /product/mountain-dew-8oz | 558 | 58,265 | 1.0% | 4.1 |
| / | 499 | 17,688 | 2.8% | 12.7 |
| /product/san-miguel-pale-pilsen-grande | 388 | 94,991 | 0.4% | 6.2 |
| /product/san-mig-light-330ml | 359 | 91,703 | 0.4% | 4.9 |
| /product/refresh-mineral-water-500ml | 345 | 30,340 | 1.1% | 8.3 |
| /product/pepsi-8oz | 337 | 26,425 | 1.3% | 6.4 |
| /articles/2025-trending-office-supply-products-in-the-philippines | 282 | 14,244 | 2.0% | 18.7 |
| /product/cobra-energy-drink-240ml-rgb | 281 | 64,783 | 0.4% | 4.6 |
| /articles/philippine-beverage-industry-2024-and-beyond | 229 | 16,860 | 1.4% | 12.2 |
| /product/sting-energy-drink-original-290ml | 210 | 38,290 | 0.5% | 5.3 |
| /product/mountain-dew-750ml | 207 | 15,836 | 1.3% | 6.6 |
| /product/tropicana-twister-orange-juice-drink-240ml | 195 | 17,089 | 1.1% | 4.4 |
| /product/zonrox-bleach-original-1000ml | 170 | 69,279 | 0.2% | 4.6 |
| /product/mountain-dew-regular-290ml | 170 | 25,359 | 0.7% | 4.8 |
| /product/c2-solo-green-tea-apple-baon-pack-230ml | 158 | 39,227 | 0.4% | 8.2 |
| /product/tiger-black-beer-1000ml | 157 | 21,488 | 0.7% | 5.0 |
What CTR and Position Reveal About Each Page
Red Horse Beer Litro. 2,073 clicks, 0.6 percent CTR, average position 5.3. This page is the workhorse. Position 5.3 means it typically appears in the middle of page one, not at the top. The 0.6 percent CTR reflects the broad range of queries it ranks for, many of which are consumer queries that generate impressions but not clicks. When the query includes "case," "litro," or "wholesale," the CTR jumps significantly. When the query is just "redhorse," the page shows but the consumer searcher scrolls past it. The lesson: even the top-performing page on the site gets most of its impressions from queries that are not its target. The clicks come from the subset of impressions where buyer intent aligns with the page.
Coca-Cola vs Pepsi Article. 753 clicks, 2.2 percent CTR, average position 10.4. This article has the highest CTR among the top pages at 2.2 percent. Position 10.4 means it often appears at the bottom of page one or top of page two. Despite ranking lower than product pages, its CTR nearly quadruples the Red Horse Litro page. Why? Because someone searching "Coca-Cola vs Pepsi market share" has a specific informational need. This article satisfies that need directly. The high CTR at a lower position proves that relevance beats rank. A page at position 10 with perfect intent match will outperform a page at position 5 with weak intent match.
Cobra vs Sting Article. 746 clicks, 1.2 percent CTR, average position 8.6. The CTR doubles the Red Horse product page. Position 8.6 is mid-to-bottom of page one. Like the Coca-Cola vs Pepsi article, comparison intent drives engagement. Buyers researching which energy drink to stock read comparison content carefully. They click when the result matches their question.
Homepage. 499 clicks, 2.8 percent CTR, average position 12.7. The highest CTR of any page on the site. Position 12.7 means it often appears on page two of search results. Yet it still earns clicks at a higher rate than pages ranking much higher. This tells us that branded and navigational searches drive homepage traffic. Someone searching "wholesale dito store" already knows who we are. They ignore everything else on the page and click our result, even if it is not ranked first. Brand familiarity overcomes poor position.
Zonrox Original 1000ml. 170 clicks, 0.2 percent CTR, average position 4.6. This page ranks well at position 4.6, typically top half of page one. Yet its CTR is the lowest among the top 20 at 0.2 percent. This is the inverse of the comparison articles. Good ranking, weak CTR. The likely cause: the page ranks for a wide range of Zonrox queries, including many consumer queries like "zonrox color safe" and "zonrox bleach." These searchers see the wholesale page, realize it is not what they want, and do not click. The strong position is earned by topical authority. The weak CTR reflects intent mismatch for a large portion of impressions.
Mountain Dew 8oz. 558 clicks, 1.0 percent CTR, average position 4.1. The best average ranking among the top 20 pages at position 4.1. This means Google consistently places this page in the top 4 results for its target queries. A 1.0 percent CTR at this position is solid for a product page. The specific bottle size in the URL likely helps match intent precisely.
San Mig Light 330ml. 359 clicks, 0.4 percent CTR, average position 4.9. Strong ranking, moderate CTR. Like Zonrox, this page likely ranks for a mix of consumer and B2B queries. The specific "330ml" variant in the URL helps filter some consumer traffic, but the broader "san mig light" queries still generate impressions without clicks.
The Pattern: High CTR Pages vs High Position Pages
Comparing pages by CTR reveals a critical insight. The pages with the highest CTR are not the pages with the best positions.
| Page Type | Example | CTR | Position |
|---|---|---|---|
| Homepage | / | 2.8% | 12.7 |
| Comparison Article | Coca-Cola vs Pepsi | 2.2% | 10.4 |
| Trend Article | 2025 Office Supplies | 2.0% | 18.7 |
| Industry Article | Beverage Industry 2024 | 1.4% | 12.2 |
| Comparison Article | Cobra vs Sting | 1.2% | 8.6 |
| Product Page | Pepsi 8oz | 1.3% | 6.4 |
| Product Page | Mountain Dew 750ml | 1.3% | 6.6 |
| Product Page | Red Horse Litro | 0.6% | 5.3 |
| Product Page | Zonrox Original 1000ml | 0.2% | 4.6 |
The articles dominate the top of the CTR column. The product pages dominate the top of the position column. This is not a contradiction. It is a segmentation of purpose.
Articles match specific informational and comparison intent. Fewer impressions, higher relevance, better CTR. Product pages rank for broad product terms. More impressions, mixed intent, lower CTR. Both are valuable. The articles capture buyers at the research and decision stage. The product pages capture buyers at the purchase stage. A B2B site needs both.
The Position Anomalies Worth Investigating
Some pages rank in positions that reveal structural issues or opportunities.
The "2025 Trending Office Supply Products" article sits at position 18.7 on average yet earns a 2.0 percent CTR. This means when it does appear, it gets clicked. Improving its position from the bottom of page two to page one would multiply its already-respectable click volume.
The "Philippine Beverage Industry 2024 and Beyond" article at position 12.2 with a 1.4 percent CTR is another candidate for position improvement. It already converts impressions well. Moving it onto page one would significantly increase traffic.
The Cobra vs Sting article at position 8.6 is on the cusp. Page one, but low. Moving it from position 8 to position 4 would likely double its click volume given the strong 1.2 percent CTR it already achieves at a lower position.
Category and Brand Pages with Full Metrics
| Page URL | Clicks | Impressions | CTR | Position |
|---|---|---|---|---|
| /product-brand/femme | 99 | 11,880 | 0.8% | 7.5 |
| /product-category/janitorial-and-maintenance-supplies | 92 | 5,318 | 1.7% | 26.5 |
| /product-brand/sting | 84 | 7,172 | 1.2% | 11.5 |
| /product-brand/san-miguel | 38 | 3,964 | 1.0% | 19.3 |
| /unbranded-paper-towels | 43 | 2,078 | 2.1% | 12.4 |
| /product-brand/mountain-dew | 22 | 1,371 | 1.6% | 18.9 |
| /product-brand/gatorade | 20 | 713 | 2.8% | 12.0 |
| /product-category/breakroom-and-pantry-supplies | 32 | 2,637 | 1.2% | 20.3 |
The janitorial supplies category page has a 1.7 percent CTR but sits at position 26.5, which is page three of search results. This is a glaring optimization opportunity. Buyers searching for janitorial supplies wholesale are high-intent. The page converts when seen. It simply is not being seen enough. Improving its position would likely yield significant click growth.
The Gatorade brand page has a 2.8 percent CTR at position 12.0. This matches the pattern of brand pages converting well because searchers know exactly what they want. The San Miguel brand page at position 19.3 has a 1.0 percent CTR. Brand familiarity drives clicks even from poor positions.
The Article Portfolio Performance
| Article URL | Clicks | Impressions | CTR | Position |
|---|---|---|---|---|
| /articles/are-funds-in-e-wallets-like-gcash-and-maya-covered-by-pdic | 68 | 46,927 | 0.1% | 7.6 |
| /articles/lazada-unjust-wrong-weight-charges-on-sellers | 60 | 3,378 | 1.8% | 8.1 |
| /articles/free-tool-that-compares-grocery-prices-across-supermarkets | 39 | 1,230 | 3.2% | 7.5 |
| /articles/lazada-seller-tips-how-to-avoid-sales-return-and-losses | 31 | 11,205 | 0.3% | 16.9 |
| /articles/horeca-supply-chain-case-study-philippines | 9 | 250 | 3.6% | 8.2 |
| /articles/gender-responsive-procurement-grp-pilot-event-recap-2026-wbe | 6 | 234 | 2.6% | 7.6 |
| /articles/security-bank-collect-and-nofee-comparing-transaction-fees-and-settlement-speed | 6 | 345 | 1.7% | 10.7 |
| /articles/engineering-the-fastest-b2b-wholesale-platform-in-the-philippines | 3 | 161 | 1.9% | 9.7 |
The grocery price comparison tool article has a 3.2 percent CTR at position 7.5. The HORECA case study has a 3.6 percent CTR at position 8.2. The gender-responsive procurement article has a 2.6 percent CTR at position 7.6. These niche, high-relevance articles consistently achieve CTRs that product pages cannot match.
The PDIC e-wallet article has a 0.1 percent CTR despite 46,927 impressions and position 7.6. This is a consumer finance topic ranking well but attracting mostly consumer impressions that do not click through to a B2B site. The high impression count masks the poor CTR. This is the same pattern we observed with "redhorse price" at the query level. High volume, low relevance, low CTR.
What the Position Data Teaches About Google's Understanding
Average position is a proxy for how well Google understands what a page is about and who it should serve. Pages with strong positions on relevant queries indicate that Google correctly interprets the page's purpose.
The Red Horse Litro page at 5.3 and the Mountain Dew 8oz page at 4.1 show that Google trusts these pages for their respective product queries. The Zonrox pages at 4.6 and 3.4 show strong rankings in the cleaner category. Google understands these are product pages for wholesale buyers.
The articles at positions 8 to 19 show that informational content faces more competition. Industry analysis, comparison content, and trend pieces compete with established publishers, news sites, and industry associations. Our articles earn their positions against this broader competitive set. The 2.0 to 3.6 percent CTRs on these articles demonstrate that when they do appear, they win clicks because they match specific buyer questions that generalist publishers do not answer directly.
Part V: What B2B Queries Actually Look Like
Stepping back from individual categories, several structural patterns emerge across the entire 16-month dataset. These patterns distinguish B2B search behavior from consumer search behavior.
The Bulk Modifier Pattern
B2B buyers attach specific modifiers to their product searches. These words signal institutional purchase intent:
| Modifier | Example Queries from Our Data |
|---|---|
| case | 1 case redhorse litro price, 1 case san mig light price |
| wholesale | red horse wholesale price, san mig light wholesale price |
| supplier | redhorse supplier near me, red horse supplier |
| distributor | red horse distributor near me, sting distributor |
| price per | san mig light price per case, san mig light price per bottle |
| 1 liter | zonrox 1 liter price, redhorse price 1 liter |
A consumer types "redhorse price." A business types "1 case redhorse litro price." The modifier is the signal. Our page data confirms this. The Red Horse Litro product page, which is structured around bulk case purchasing, is the highest-clicked page on the site.
The Comparison Pattern
We already detailed the Sting versus Cobra phenomenon. But comparison behavior appears elsewhere across the 16-month period:
| Query | Impressions |
|---|---|
| coca cola vs pepsi market share | 455 |
| coke vs pepsi market share | 407 |
| pepsi vs coca cola | 233 |
B2B buyers do not just compare individual products. They compare market share data. This suggests strategic purchasing where understanding brand strength informs inventory decisions. Our Coca-Cola versus Pepsi article earning 753 clicks with a 2.2 percent CTR validates that this comparison intent is strong enough to build content around.
The Research Pattern
Not every B2B query is transactional. A meaningful subset is informational research that precedes purchasing:
| Query | Impressions |
|---|---|
| beverage industry in the philippines | 317 |
| soft drinks in the philippines | 508 |
| drinks in the philippines | 457 |
| energy drinks philippines | 546 |
| office supplies philippines | 869 |
| wholesale suppliers philippines | 236 |
These queries suggest buyers at the beginning of their procurement journey. They are mapping the landscape before reaching out to specific suppliers. Our article "Philippine Beverage Industry 2024 and Beyond" earning 229 clicks at a 1.4 percent CTR proves that industry overview content captures this early-stage research traffic effectively.
Part VI: What This Data Means for B2B Search Strategy
After 16 months of observing query patterns, page performance, CTR, and position data from March 2025 through July 2026, several principles have become clear.
Principle One: Optimize for the Bulk Buyer, Not the Browser
The highest impression queries in our dataset are consumer queries. They generate visibility but not clicks. The queries that drive actual engagement are those with explicit bulk or wholesale intent. Our page data confirms this. The Red Horse Litro product page, structured around case purchasing, outperforms every other page despite a moderate 0.6 percent CTR. The clicks it does earn come from the subset of impressions where buyer intent matches.
Product pages should lead with case quantities, bulk pricing structures, and institutional specifications. The buyer searching "1 case redhorse litro price" should land on a page that immediately answers that question.
Principle Two: Capture Every Variant
Query fragmentation for Red Horse is extreme. "Redhorse" versus "red horse" alone splits the search volume. The Red Horse Litro page succeeds because its URL, title, and content target the specific variant that institutional buyers use most. But the 0.6 percent CTR at position 5.3 suggests there are still impression opportunities being lost to variant mismatches. Each variant represents a real buyer. Missing one variant means missing that buyer.
Principle Three: The Comparison Page Is a Traffic Engine with Superior CTR
The Sting versus Cobra article earned 746 clicks at a 1.2 percent CTR. The Coca-Cola versus Pepsi article earned 753 clicks at a 2.2 percent CTR. Both outperform product pages on CTR despite ranking at worse positions. This is the most important finding in the page performance data. Comparison content converts impressions into clicks at double to triple the rate of product pages.
Buyers are actively searching for comparisons. A thorough, factual comparison page that covers caffeine content, pricing, bottle sizes, and availability captures this traffic and serves the buyer exactly what they are looking for. The same logic applies to every product category where buyers choose between brands or formats.
Principle Four: Informational Content Builds Early Pipeline at Strong CTRs
Our industry articles earning clicks month after month prove that being present during the research stage establishes the business as a knowledgeable supplier. The beverage industry article at a 1.4 percent CTR and the office supplies trends article at a 2.0 percent CTR demonstrate that informational content converts. These articles rank at positions 12 and 19 respectively, meaning there is significant untapped traffic potential if their positions improve.
Principle Five: Click Data Is More Honest Than Impression Data
Impressions measure visibility. Clicks measure interest. CTR measures efficiency. The three together tell the full story. A page with 364,024 impressions and a 0.6 percent CTR is a different animal than a page with 34,365 impressions and a 2.2 percent CTR. The former is a catch-all net. The latter is a surgical instrument.
The PDIC e-wallet article with 46,927 impressions and a 0.1 percent CTR is the cautionary example. High impressions alone mean nothing if the intent does not match. B2B search strategy should prioritize CTR and click data when evaluating what is working.
Principle Six: Page Speed Directly Impacts B2B Conversion
A slow-loading product page does not just hurt rankings. It kills procurement decisions. Institutional buyers often work from office networks with shared bandwidth. A product page that loads in 4 seconds instead of 2 seconds can be the difference between a quote request and a bounced session. Google's Core Web Vitals measure this through Largest Contentful Paint, First Input Delay, and Cumulative Layout Shift. Our site targets sub-2-second mobile load times across all product pages. This is not a technical vanity metric. It is a revenue protection measure.
Principle Seven: Brand Pages Capture Repeat Procurement Traffic
The Femme brand page earning 99 clicks at 0.8 percent CTR and the Sting brand page earning 84 clicks at 1.2 percent CTR reveal a procurement behavior pattern. Buyers who already know which brand they need search directly for the brand name plus "wholesale" or "supplier." Brand aggregation pages that list all available SKUs for a single brand serve this repeat buyer efficiently. Every brand carried should have a dedicated landing page optimized for brand-plus-wholesale search queries.
Principle Eight: Separate Your B2B and Consumer Traffic Strategically
This principle emerged from the data rather than being planned from the start. The consumer queries generating impressions without clicks were not failures. They were signals. They told us that a different audience existed, one that wanted our products but in retail quantities and at retail prices. Rather than dilute the wholesale focus of Wholesale Dito Store, we launched LowPriceDito.com as a dedicated retail channel. This strategic split keeps each site's topical authority clean and focused. Google understands what each site offers. Buyers find what they expect when they click.
For any B2B wholesaler seeing high-impression, low-CTR consumer queries, the lesson is not to chase that traffic on the wholesale site. The lesson is to recognize the demand and decide whether to serve it through a separate channel or to accept it as irrelevant noise. We chose to serve it. But we did so without compromising the B2B focus that drives our actual revenue.
Part VII: What We Would Do Differently
Looking back at the 16 months from March 2025 through July 2026, several opportunities stand out that any B2B wholesaler can learn from. Some of these are already underway.
Create dedicated bulk pricing pages. The query "1 case redhorse litro price" generated 89 clicks. Those buyers deserve a page built specifically for them, not a general product page that happens to mention case quantities. The Red Horse Litro page is already the top performer. A dedicated case-pricing page with volume discount tiers could convert even better.
Build comparison content systematically. The Sting versus Cobra and Coca-Cola versus Pepsi articles together earned nearly 1,500 clicks with CTRs of 1.2 percent and 2.2 percent respectively. Every product category with two or more competing brands is an opportunity for a comparison page. Red Horse versus San Miguel. Zonrox Colorsafe versus Zonrox Original. Mountain Dew versus Pepsi. Each comparison captures buyers at the moment of decision.
Address ingredient and specification questions. Buyers searching for alcohol content, caffeine content, and product ingredients are conducting due diligence. Providing this information directly on product pages reduces friction in the procurement process. A procurement officer who finds the caffeine content of Cobra Energy Drink on our product page does not need to search elsewhere and risk landing on a competitor's site.
Structure site navigation around pack sizes. The fragmentation in our query data suggests that buyers think in terms of cases, liters, and jumbo formats. Site architecture and page titles should mirror this mental model. The success of the Red Horse Litro page validates this approach.
Track clicks, CTR, and position together, not just rankings. The query "red horse wholesale price" earned 75 clicks from 688 impressions across the 16-month period. The Zonrox Original 1000ml page ranks at position 4.6 but has a 0.2 percent CTR. The comparison articles rank at positions 8 to 10 but have CTRs of 1.2 to 2.2 percent. Vanity metrics like total impressions or position alone obscure what actually matters. CTR at a given position is the real performance indicator.
Audit page speed quarterly. Site speed is not a one-time fix. New product images, plugin updates, and content additions can degrade load times gradually. We recommend a quarterly Core Web Vitals audit using Google PageSpeed Insights and Search Console data to catch regressions before they impact rankings or buyer experience.
Invest in brand landing pages. The Femme, Sting, and Gatorade brand pages earning consistent clicks at CTRs above 1.0 percent prove that brand-level search traffic is worth capturing. Every major brand in the product catalog should have a dedicated, optimized landing page that aggregates all available SKUs and includes wholesale-specific pricing and bulk order information.
Improve position on high-CTR articles. The "2025 Trending Office Supply Products" article at position 18.7 with a 2.0 percent CTR is a clear optimization target. Moving it from page two to page one would multiply its click volume. The same applies to the beverage industry article at position 12.2 with a 1.4 percent CTR. These articles already convert. They just need to be seen by more people.
Maintain the strategic separation between B2B and consumer channels. The data validated this decision. Consumer queries on the wholesale site generate impressions without clicks. Those same queries on LowPriceDito.com convert because the retail site matches their intent. Continuing to invest in both channels separately, with clear audience definitions for each, will compound the organic traffic gains of the past 16 months.
Build for agentic AI now, not later. This is already in progress. The next version of Wholesale Dito Store is being architected to serve three audiences simultaneously: human buyers, traditional search engine crawlers, and autonomous AI agents. The 16 months of search data taught us what human buyers want. The next phase of technical development ensures that when a procurement AI agent asks "which Philippine wholesaler has the best case price on Red Horse Litro and can deliver to Makati by Thursday," our product data, pricing, and logistics information are structured in a way the agent can read, evaluate, and recommend. Most B2B wholesalers are not thinking about this yet. The query data we have collected gives us the foundation to build it before it becomes an industry requirement.
Summary: What 16 Months of Search Data Taught Us
Sixteen months of search data and page performance data from March 2025 through July 2026 gave us a clear picture of how institutional buyers in the Philippines search for wholesale products. Here are the findings that matter most.
B2B buyers signal their intent with specific modifiers.
Words like "case," "wholesale," "supplier," and "price per" separate institutional purchasers from consumers. These modifiers are the difference between an impression and a click.
Red Horse Beer dominates search demand but fragments across dozens of query variants.
The Red Horse Litro page earned 2,073 clicks, more than any other page. Capturing this demand requires covering every variant: redhorse and red horse, litro and 1 liter, case and wholesale.
Comparison content outperforms product pages on CTR.
The Coca-Cola vs Pepsi article at 2.2 percent CTR and the Cobra vs Sting article at 1.2 percent CTR convert impressions into clicks at rates product pages cannot match. Comparison content answers the question buyers are asking when they are deciding between brands.
Articles serve the research stage of procurement.
Industry overviews, trend pieces, and case studies attract buyers before they submit a request for quotation. The HORECA case study at 3.6 percent CTR and the grocery price comparison tool article at 3.2 percent CTR prove that niche, high-relevance content earns engagement.
Position and CTR tell different stories.
Product pages rank better on average. Articles convert better on average. A B2B site needs both. Product pages capture purchase-ready buyers. Articles capture buyers at the research and decision stage.
Consumer queries are not B2B failures. They are a different channel.
The high-impression, low-CTR consumer queries led to the creation of LowPriceDito.com, a dedicated retail site that serves individual buyers and sari-sari stores. Strategic channel separation keeps both sites focused and effective.
International B2B demand exists and converts at higher rates.
Buyers from 108 countries found the site. Markets like Australia, Hong Kong, UAE, and Saudi Arabia show higher CTRs than the Philippine average. These are importers, restaurant groups, and distributors actively sourcing Philippine products.
Page speed is a B2B conversion factor.
Institutional buyers on shared office networks do not tolerate slow pages. Sub-2-second load times protect rankings and prevent procurement officers from bouncing to competitors. With 67 percent of traffic on mobile, mobile speed is not optional.
Structured data drives measurable click volume.
Product snippets generated 4,800 clicks. Review snippets added 550 more. These are direct results of schema markup implementation. Structured data is not an SEO theory. It is a traffic engine with verifiable output.
Agentic AI is the next procurement channel, and we are building for it now.
The next version of Wholesale Dito Store is being architected to be legible to autonomous AI agents that will search, evaluate, and purchase on behalf of business buyers. The query data collected over 16 months provides the foundation for this build.
The data rewards clarity.
Google sends traffic to pages that match intent. When a page clearly signals it serves wholesale buyers, it attracts wholesale buyers. When a query clearly signals wholesale intent, it generates clicks. The alignment between what a page offers and what a searcher wants is the engine that drives every metric that matters.
The data does not lie. The question is whether the website, from its architecture to its page speed to its content strategy to its relationship with sister channels to its readiness for agentic search, is built to match what the data reveals. Ours is getting there.